A Brief Introduction to FD-NIRS
Diffuse optics, optical properties, and physiological measurement
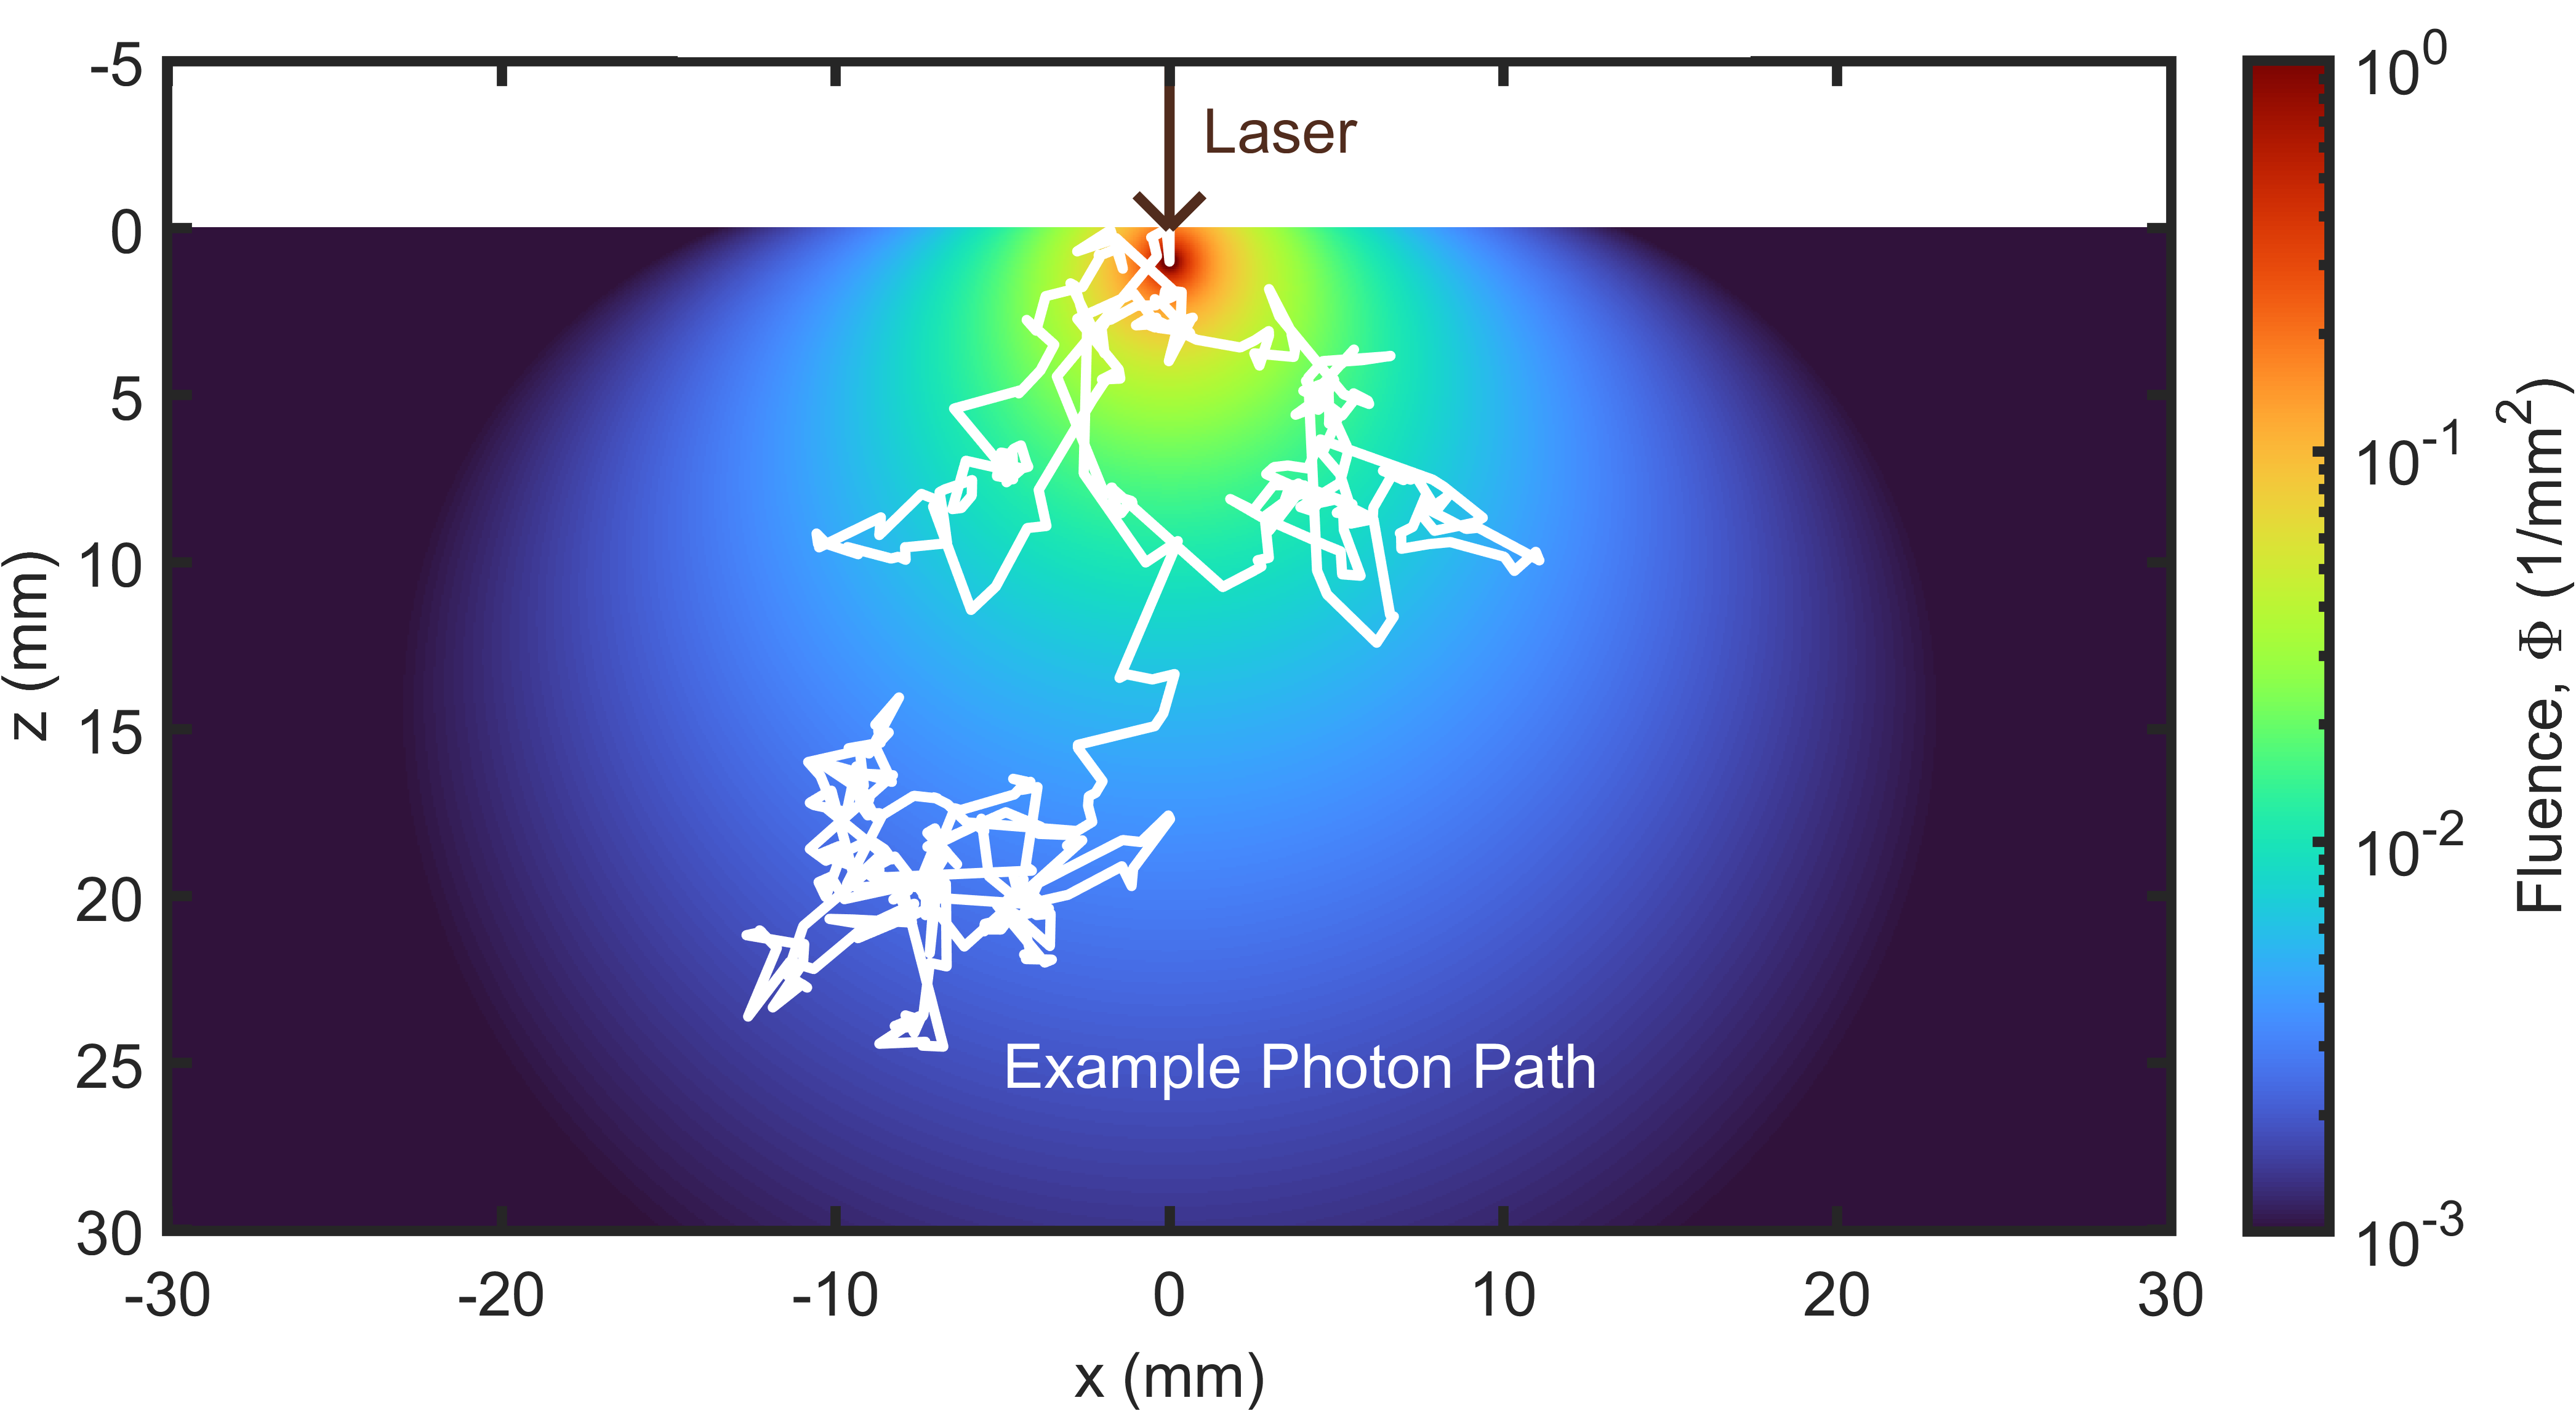
To understand what FD-NIRS is, we must first understand the optically diffuse medium. In an optically diffuse medium light moves about by randomly changing the direction it's traveling. Particles representing packets of light are called photons. The act of these photons randomly changing direction is called scattering. Therefore, an optically diffuse medium is one in which the behavior of photons is mostly described by their scattering. An example of a possible random photon path from scattering can be seen in Figure 1.
Many familiar media are optically diffuse. For example, a cloud is optically diffuse — photons enter, randomly scatter within, then exit. Due to this random scattering, your eye cannot determine where a photon entered the cloud, so the cloud appears opaque or white. In general, an optically diffuse medium appears opaque.
Scattering is not the only thing that may happen to a photon in a diffuse medium. A second common property is absorption: photons are lost when they interact with the medium. Take a black cup of coffee — this medium is primarily absorbing, since photons die off as they travel through the liquid, with little scattering and little change in direction.1 If the coffee is strong and dark it has high absorption; if it is light and watery it has low absorption. Adding milk makes the coffee opaque by introducing scattering and randomizing the photons' directions within the liquid. Adding cream makes it even more opaque, since cream has higher scattering than milk.
Both absorption and scattering are probabilistic: every time a photon interacts with the medium there is some chance it will be absorbed, scattered, or neither. Since these interactions occur billions of times, the average behavior of the photons becomes rather predictable — analogous to flipping a coin billions of times and reliably predicting that close to half will come up heads. An example of this predictable average distribution of photons can be seen in Figure 1. Focusing on diffusion theory, which describes optically diffuse media, this average behavior can be modeled using two optical properties: the absorption coefficient (μa) and the reduced scattering coefficient (μ′s).
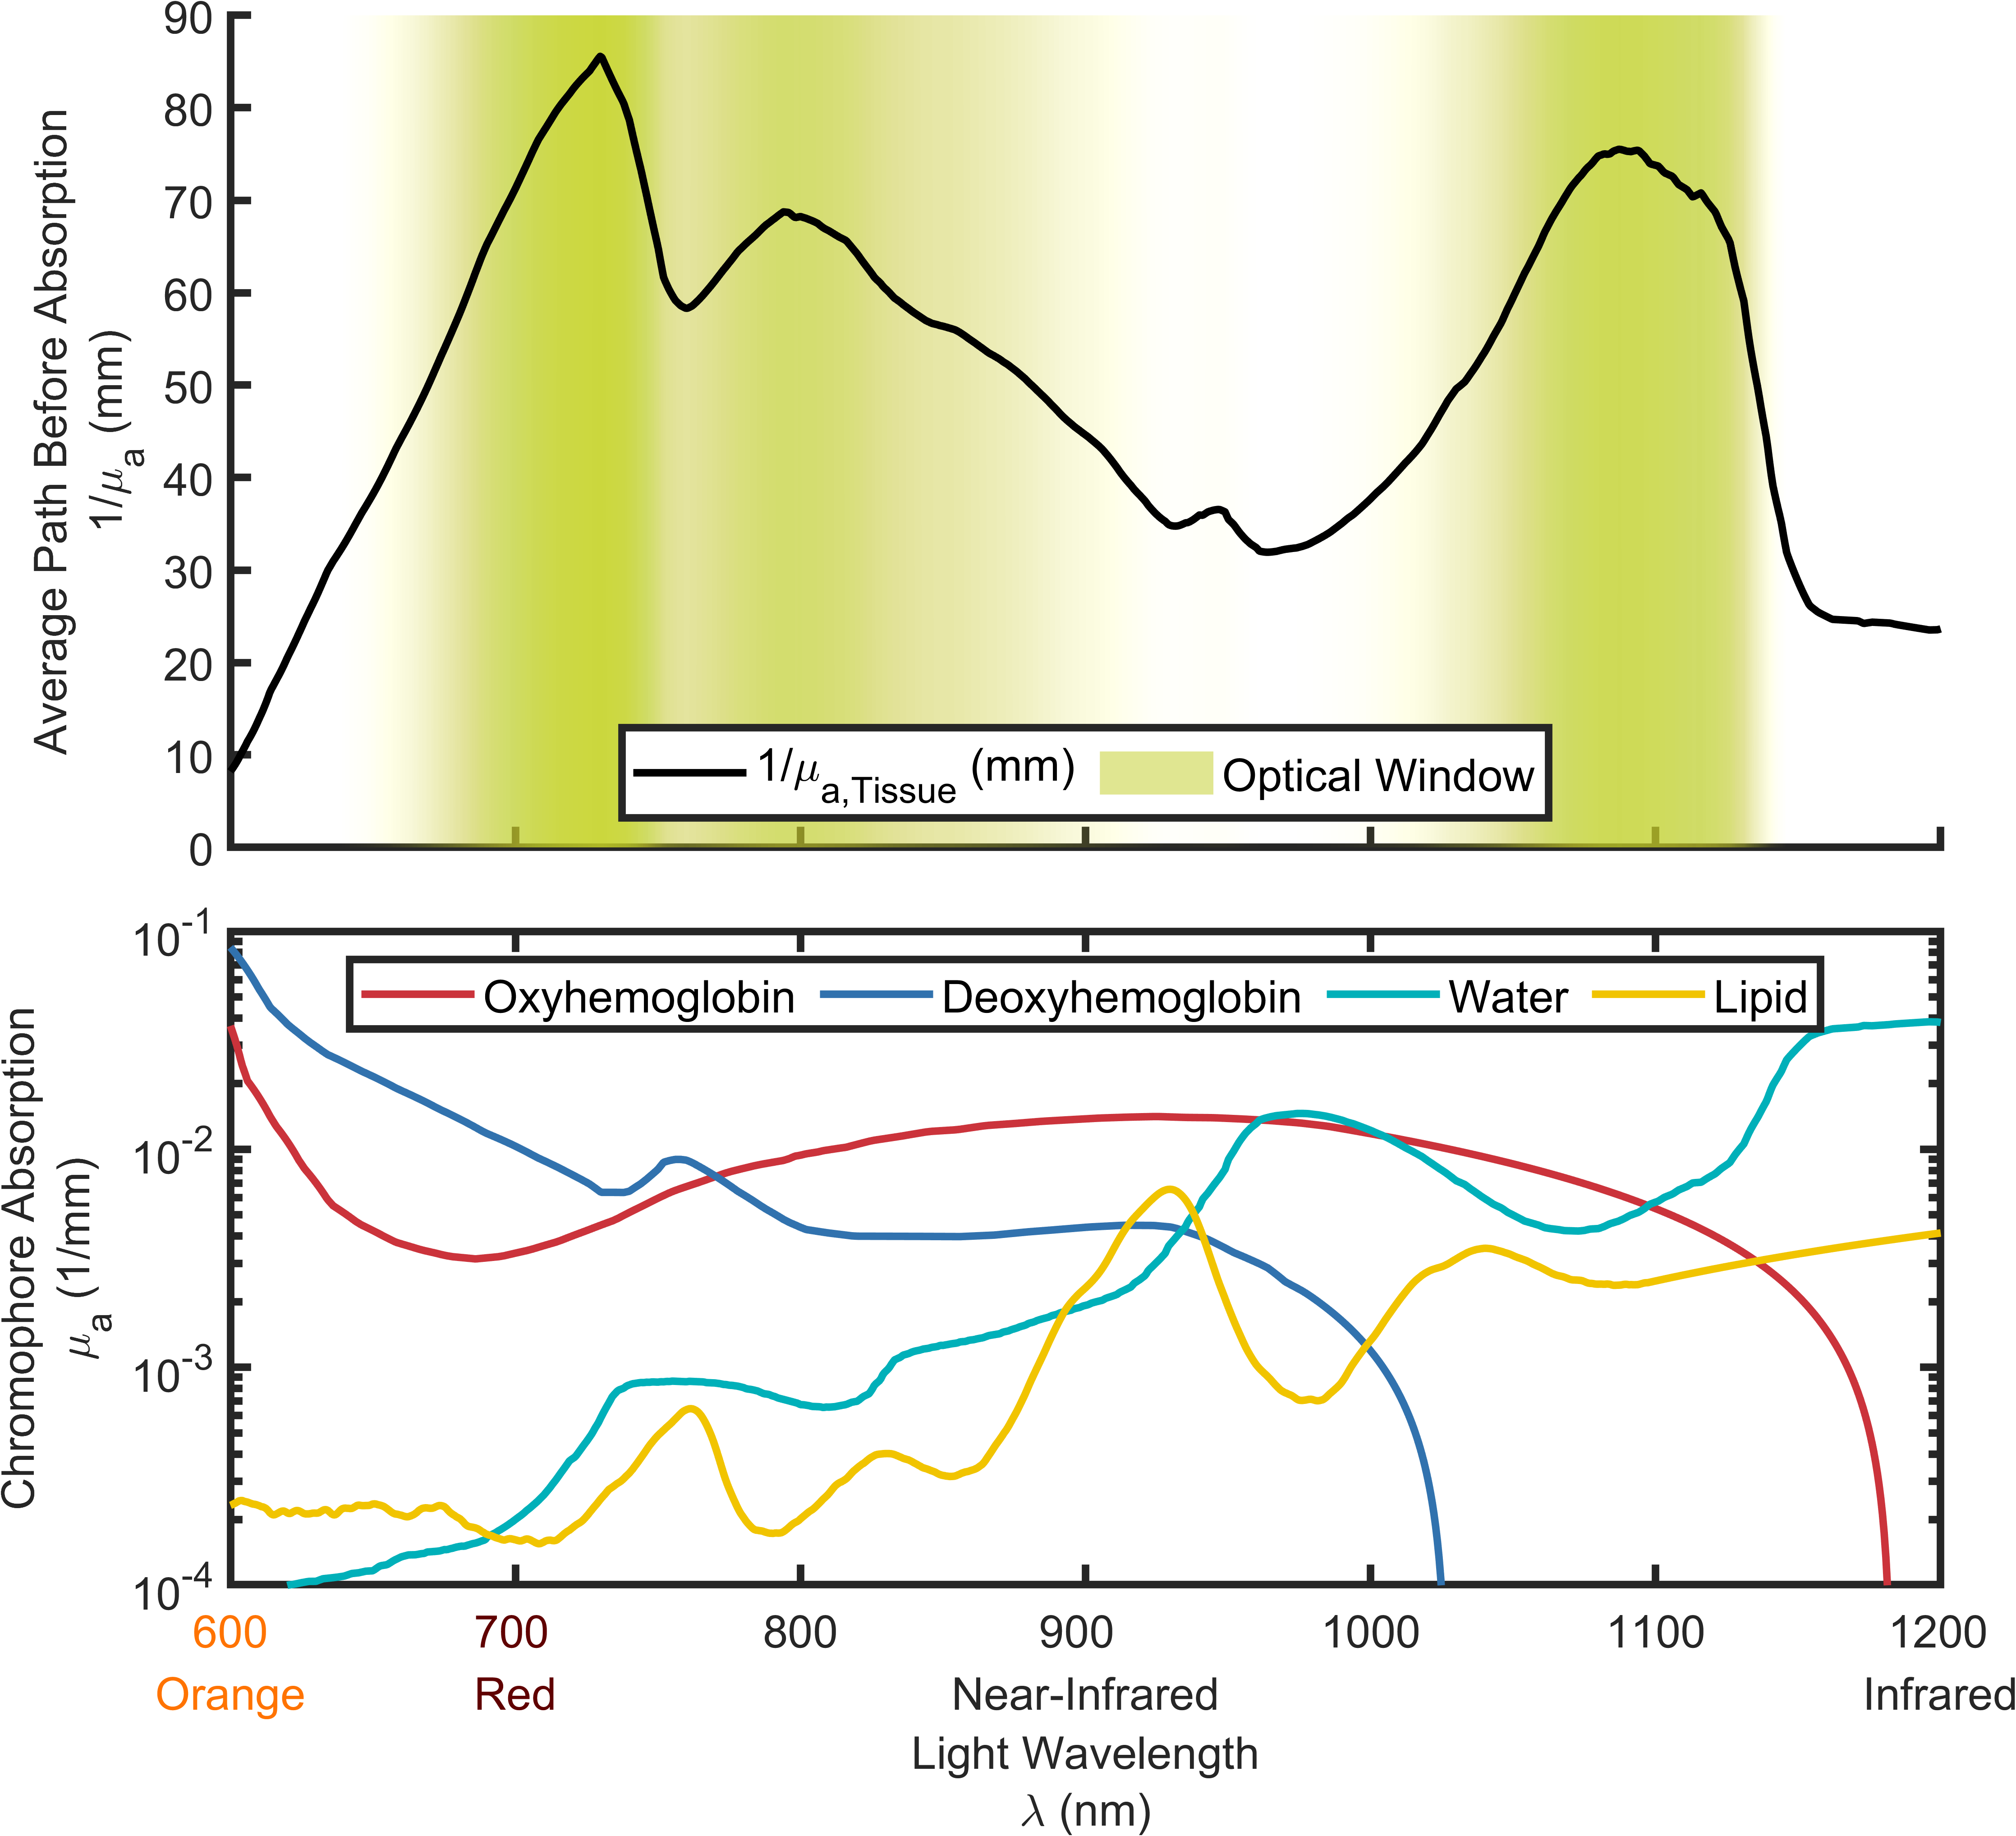
FD-NIRS seeks to measure these two properties — μa and μ′s — to characterize a diffuse medium. In general, μa provides chemical information about the medium, like the strength of the coffee in the example above, and μ′s provides structural information, like the amount of fat droplets from cream in the coffee. A popular application of NIRS is in the measurement of biological tissues, where μa gives information about blood concentrations. The μa of blood depends on wavelength (λ), which can be thought of as the color of the light. A typical dependence of μa on λ is shown in Figure 2. NIRS — Near-Infrared Spectroscopy — focuses on wavelengths from red to near-infrared2 because biological tissue has relatively low absorption in this range, allowing photons to probe further into tissue. Figure 2 also shows the average path-length before absorption versus λ, illustrating this so-called optical window of tissue.
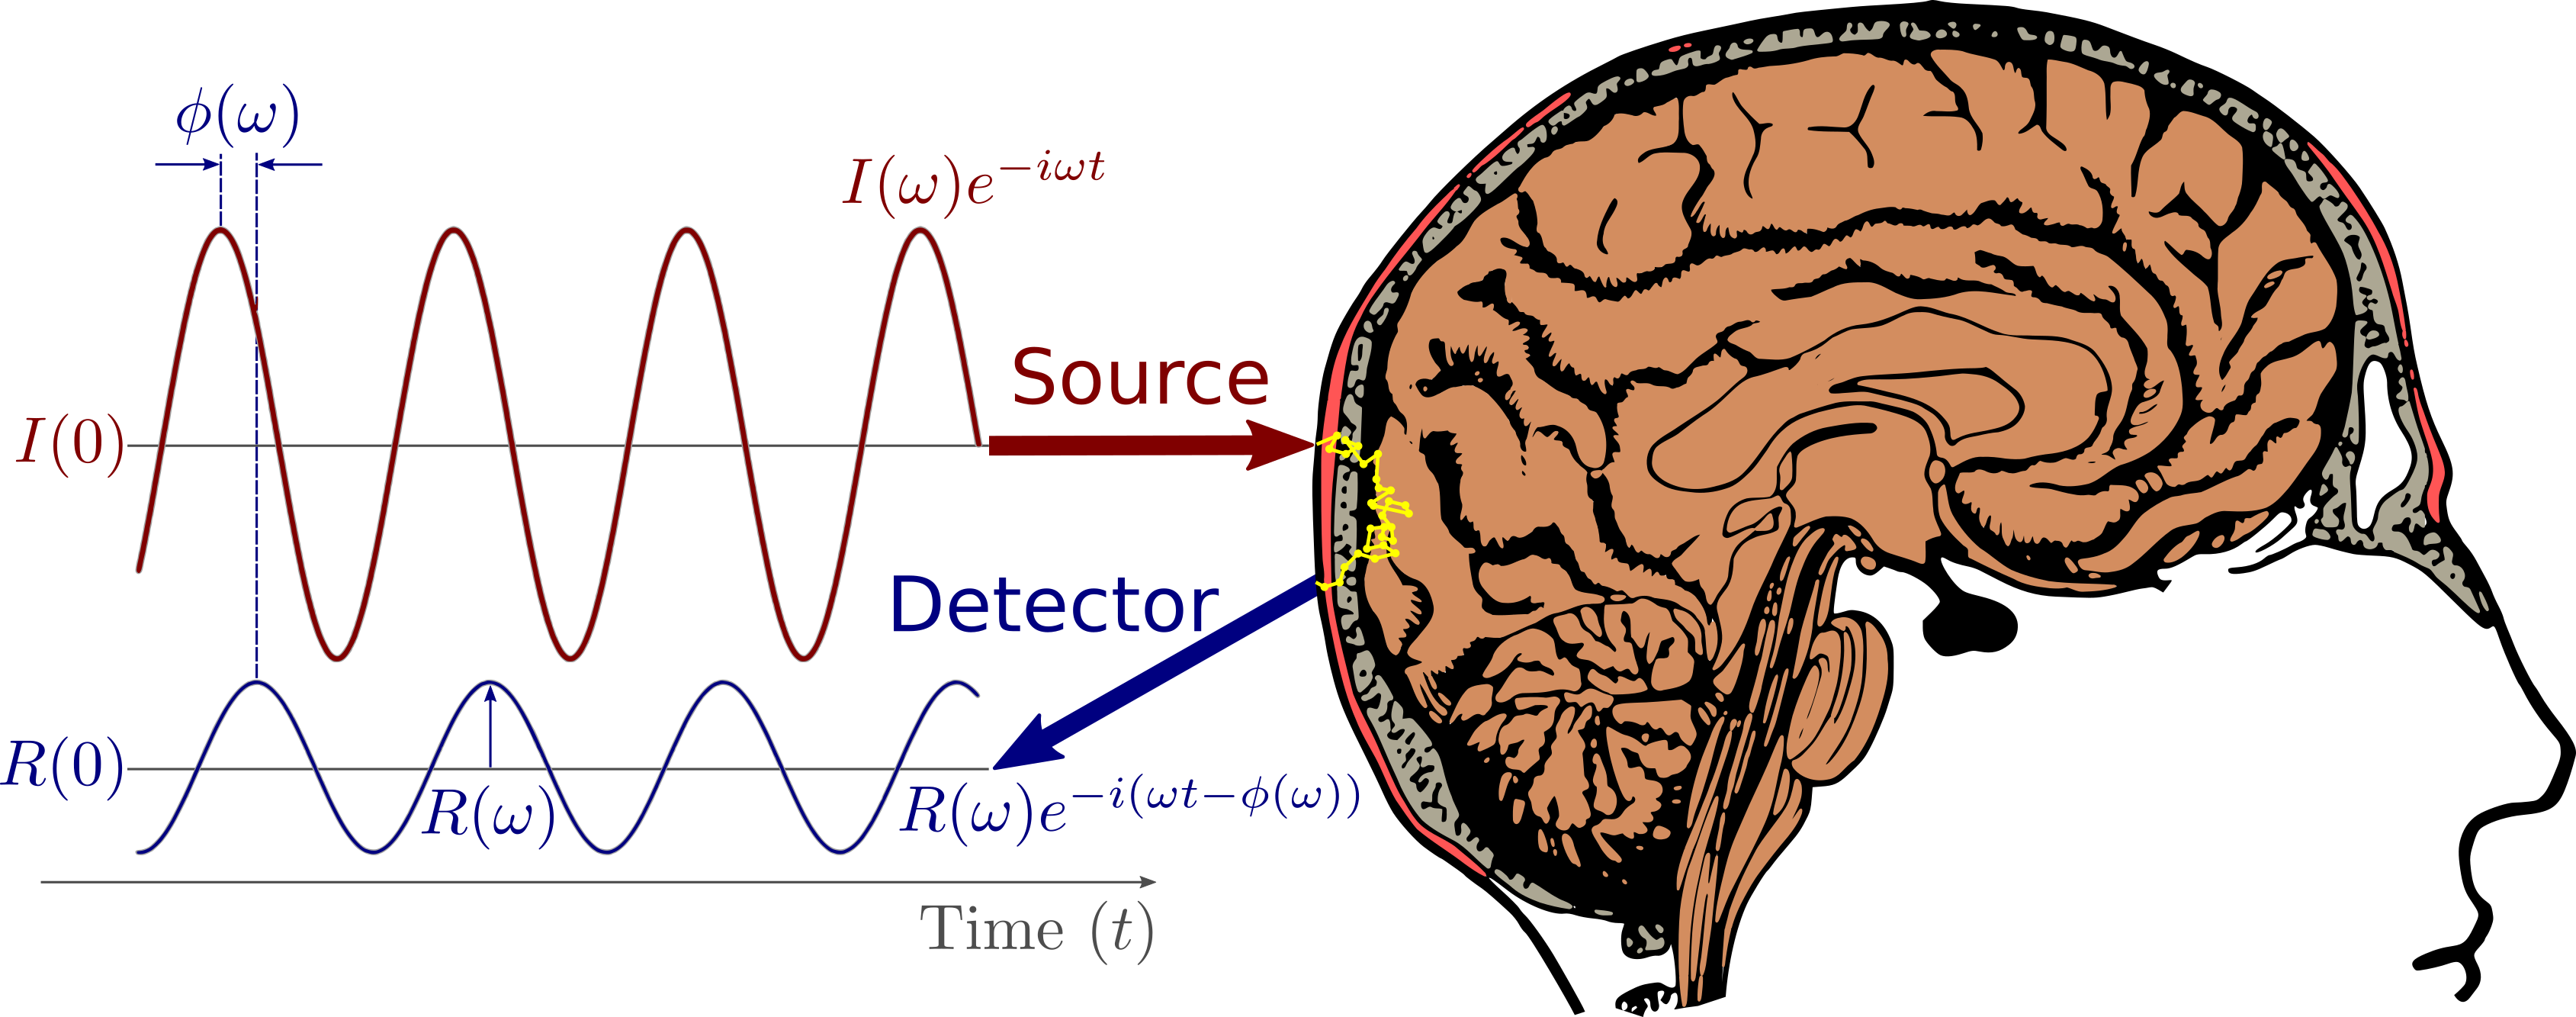
In practice, a source injects photons into a medium and the light is detected at another point separated by a source-detector distance ρ.3 The way the source light varies in time defines the flavor of NIRS: continuous-wave (CW), frequency-domain (FD), or time-domain (TD). In CW the source is constant; for FD the intensity oscillates sinusoidally;4 and TD uses a brief pulse. For FD specifically, the detected light has an oscillation amplitude (I) and a time shift called the phase shift (φ) — two pieces of information that can be translated into the two desired properties, μa and μ′s.
Diffuse optics finds applications across many fields — food inspection and evaluation, pharmaceutical particle and powder characterization, archaeological soil analysis, dendrology (the study of wood), and art authentication, among others. In biological tissue specifically, it is used for clinical brain monitoring, studying brain activation, breast imaging, and muscle measurements in sports science.
Regardless of application, a laboratory can purchase a commercially available FD-NIRS instrument. These instruments provide FD measurements at multiple discrete wavelengths, retrieving the amplitude (I) and phase shift (φ) of the detected light. They can therefore be used for absolute measurement of μa and μ′s, or for dynamic tracking of μa changes interpreted as hemodynamics.
As a specific example, consider FD-NIRS applied to the human brain. When a person experiences a visual stimulus, the visual portion of their brain begins utilizing more oxygen. The body responds by increasing blood flow to the visual cortex — indicated by a rise in oxyhemoglobin (HbO2) concentration and a fall in deoxyhemoglobin (Hb) concentration. Since these concentrations are connected to μa through their wavelength-dependent absorption spectra, this change can be measured with FD-NIRS. An experiment may be devised to make these functional NIRS (fNIRS) measurements as shown in Figure 3 — sinusoidal light is injected into the subject's head, diffuses through the brain, and is detected. The phase shift and amplitude of the detected light are converted to optical properties and blood concentrations, and changes in HbO2 and Hb indicate blood flow and brain activity. This example illustrates just one application in which FD-NIRS may be used to make measurements on tissue.
- Credit for this example goes to Prof. Steven Jacques.
- This near-infrared wavelength range is approximately 600–1000 nm.
- ρ is typically on the order of 10 mm.
- The modulation frequency is on the order of 100 MHz for FD-NIRS.
Originally published in: Blaney, G. Enabling Deep Region Specific Optical Measurements in a Diffusive Medium with Near-Infrared Spectroscopy. Tufts University, ProQuest Dissertations & Theses, 2022. ProQuest 29162198.